Did you know that every single day, humans manage to create 2.5 quintillion bytes of data on average? However, many of us end up representing this information the wrong way through a chart or graph that isn’t appropriate for the … Continue reading
Audience Analysis — Why a General Audience Type Is Impossible to Create a Data Story For
According to the results of a study conducted by Stanford professor Chip Heath, 63 percent of people can remember stories. By contrast, only five … Continue reading
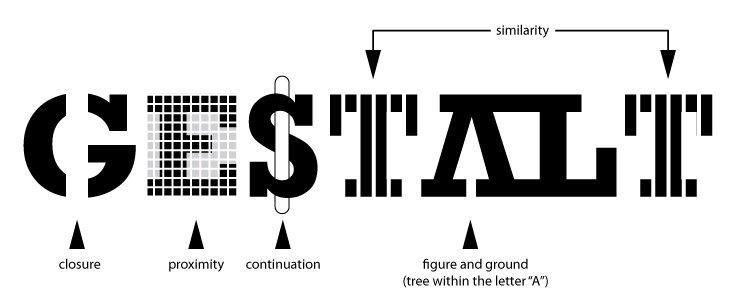
Evaluating the Role of Gestalt Principles in Visual Perception
The human brain is programmed to perceive logic, structure, and patterns. It enables us to make sense of things that happen around us. The Gestalt school of psychology emerged in Germany … Continue reading


